
Summary:
The U.S. economy is still growing, but several indicators suggest momentum has moderated. Real GDP rose 1.5% in the second quarter, unemployment remained low at 4.1%, inflation was 3.4% in July, and consumer spending continued to rise. Together, these figures point to a slower, uneven expansion rather than a clear-cut recession—at least based on currently available data.
As of early September 2026, the U.S. economy presents a mixed picture. Growth has slowed from the first quarter, the labor market is no longer producing jobs at a rapid pace, and inflation remains above the Federal Reserve’s longer-run 2% goal. At the same time, consumers are still spending, industrial production is expanding, and unemployment remains relatively low.
That combination makes the current environment difficult to describe with a single label. Americans may hear that the economy is “slowing down,” but that does not necessarily mean the country is entering a recession. Economic slowdowns can occur while businesses continue hiring, consumers continue buying and overall output continues increasing.
The better question is: Which numbers are weakening, which are holding up, and what do they mean for households?
Here are seven indicators that provide a useful snapshot.
1. Real GDP Growth: The Economy Is Expanding More Slowly
Gross domestic product, or GDP, measures the value of goods and services produced in the economy. Real GDP is particularly useful because it adjusts for inflation, giving economists a clearer picture of whether actual economic activity is increasing.
The latest estimate from the U.S. Bureau of Economic Analysis shows that real GDP increased at a 1.5% annualized rate in the second quarter of 2026, down from 2.1% in the first quarter.
That is an important slowdown, but it is not negative growth.
The distinction matters. A 1.5% growth rate suggests the economy is still moving forward, just at a more moderate pace. The second-quarter increase was supported by consumer spending, exports and investment, while government spending declined and imports increased.
There is another encouraging detail beneath the headline. Real final sales to private domestic purchasers—a measure that focuses more closely on underlying private-sector demand—rose at a 4.2% annualized rate in the second quarter, according to the BEA’s second estimate.
For an ordinary household, this distinction is useful. Imagine a local economy where restaurants remain busy, companies continue investing in equipment and consumers keep paying for services, but government activity contributes less to total growth. The headline GDP number could slow even while private demand remains relatively resilient.
What it means: GDP is flashing a yellow light rather than a red one. Growth has moderated, but the economy has not entered contraction based on the latest quarterly data.
2. Unemployment and Payrolls: The Labor Market Is Losing Momentum
Employment is one of the most important indicators for American households because wages and job security determine how much people can spend, save and borrow.
The July employment report showed an unemployment rate of 4.1%, while nonfarm payroll employment declined by 23,000 during the month. The Bureau of Labor Statistics said both measures changed little overall, with employment declining in local government education and retail trade while health care continued to add jobs.
That combination is worth watching.
An unemployment rate around 4% is not historically associated with a severely weak labor market. But a month in which payroll employment declines is considerably softer than the rapid job creation seen during stronger economic periods.
This is one reason Americans can experience an economy differently from what the unemployment rate suggests. Someone who already has a stable job may see little change. Someone searching for work may encounter fewer openings, longer hiring processes or more competition for each position.
The labor market can also deteriorate gradually rather than suddenly. Employers may first stop expanding payrolls, then reduce hiring, then cut hours or positions if demand weakens further.
What it means: The labor market is still relatively resilient, but the direction of hiring deserves attention. A sustained deterioration would be more concerning than one weak monthly report.
3. Job Openings: Employers Still Need Workers, but Hiring Conditions Matter
Job openings provide a different view of employment than the unemployment rate.
The latest fully verified JOLTS data available in the official BLS material used for this analysis showed approximately 7.4 million job openings in June, with about 5.3 million hires and 5.4 million total separations. The quits rate was 2.0%.
Why does this matter?
Consider two workers. The first has a secure job and is not looking for another position. The second has recently lost a job and is applying to dozens of companies. The unemployment rate tells us something about the second worker, but job openings tell us more about how many opportunities employers are actually offering.
A large number of openings can support workers even when hiring is slower than before. But if openings fall consistently while unemployment rises, that combination becomes a much stronger warning signal.
The BLS had scheduled its July JOLTS release for September 1, 2026, meaning the latest month’s data are arriving around the time of publication.
This is also why economic data should not be treated as a collection of isolated numbers. Payrolls, unemployment, job openings, hires and quits each reveal a different part of the labor market.
What it means: The labor market has not simply “collapsed.” The more important question is whether employer demand for workers continues weakening over several months.
4. Inflation: Prices Are Still Rising Faster Than the Fed Would Like
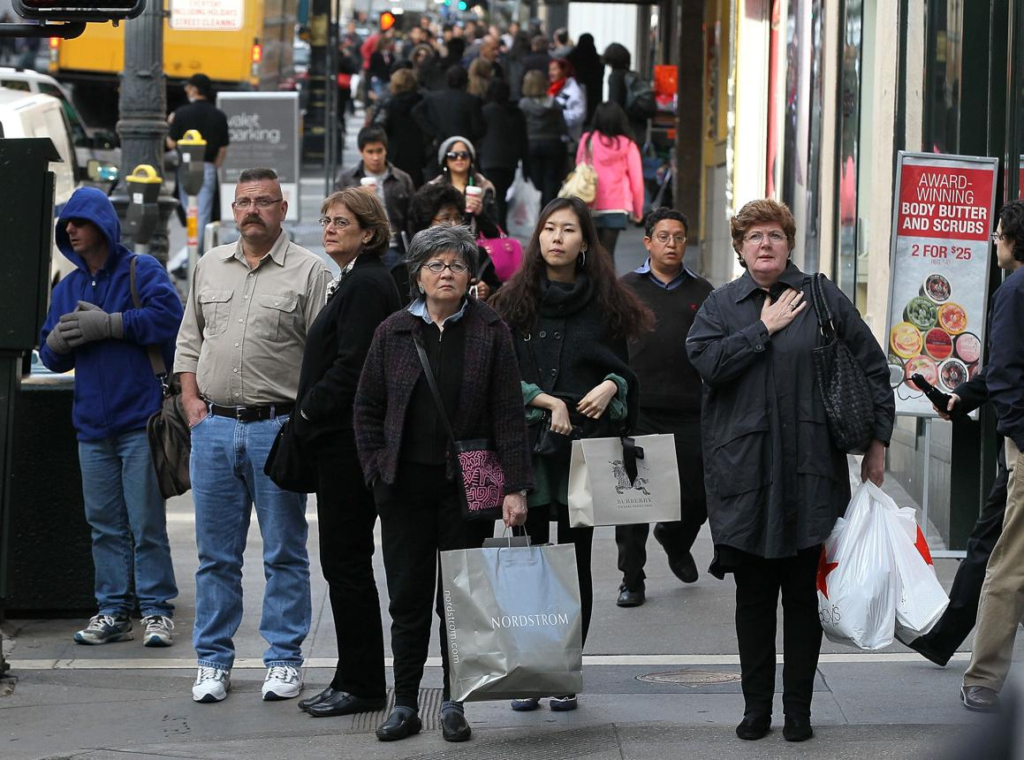
Inflation is perhaps the economic statistic Americans feel most directly.
The latest Consumer Price Index report showed that consumer prices increased 0.1% in July on a seasonally adjusted basis and were 3.4% higher than a year earlier. Shelter accounted for roughly two-thirds of the monthly increase, while energy prices declined 1.5%.
A 3.4% annual inflation rate is dramatically different from the extremely high inflation experienced during the pandemic-era surge, but it is still meaningful.
Suppose a household spends $4,000 per month on goods and services. Inflation does not mean every item becomes 3.4% more expensive. It means the overall consumer price basket is higher on average. Housing, groceries, insurance, medical services, gasoline and other expenses can move at very different rates.
That distinction explains why national inflation statistics can feel disconnected from individual experiences.
Shelter is particularly important because housing costs represent a large share of household budgets. Even when energy prices fall, persistent housing-related inflation can keep pressure on overall prices.
The July data also showed food prices rising 0.1% for the month, with food-away-from-home prices increasing 0.3%.
What it means: Inflation has cooled substantially from its peak, but price pressures have not disappeared. For households, the key issue is not only whether inflation is falling, but whether incomes are rising faster than prices.
5. Consumer Spending: Americans Are Still Supporting Growth
Consumer spending is one of the most important supports for the U.S. economy because household consumption represents a large share of total economic activity.
In July, personal consumption expenditures increased 0.2%, while disposable personal income increased 0.5%, according to the BEA. Personal income increased 0.4%.
The composition of spending is particularly interesting. Spending on services increased while spending on goods declined. The BEA reported that the $36.3 billion increase in current-dollar PCE reflected an $86.2 billion increase in services spending, partly offset by a $49.9 billion decrease in goods spending.
This suggests consumers have not stopped spending. Instead, the mix of spending is changing.
For example, a household might postpone purchasing a new television or vehicle while continuing to spend on health care, travel, restaurants, insurance, education or other services.
Personal saving also provides useful context. The personal saving rate was 3.0% in July.
That relatively modest saving rate illustrates one vulnerability in consumer demand: households can continue supporting economic activity, but their ability to absorb future shocks depends partly on income growth, debt levels and accumulated savings.
What it means: Consumer demand remains an important source of resilience. If consumers begin cutting spending broadly, the slowdown could become more pronounced.
6. Retail Sales: The Headline Looks Weaker Than the Yearly Trend
Retail sales offer another window into consumer behavior, although they are not adjusted for inflation in the same way as real GDP.
According to the Census Bureau, advance retail and food-service sales totaled $763.6 billion in July 2026, down 0.6% from June but up 5.0% from July 2025. Sales for May through July were 6.3% higher than the same period a year earlier.
At first glance, a 0.6% monthly decline might sound alarming. The year-over-year figure tells a more balanced story.
This is a good example of why one-month economic numbers can be misleading. Retail sales are affected by seasonal patterns, promotions, vehicle purchases, weather and other temporary factors. Looking at several months together can provide a clearer signal.
There is also an important difference between nominal sales and real purchasing power. If consumers spend more dollars because prices are higher, sales can increase without households necessarily buying proportionally more goods.
That is why economists compare retail sales with inflation and other measures of real consumption.
What it means: Retail activity is not showing a straightforward consumer collapse. The monthly decline deserves attention, but annual growth remains positive.
7. Industrial Production: Factories Are Still Expanding Output
Industrial production provides a useful counterweight to concerns about an economic slowdown because it measures activity in manufacturing, mining and utilities.
Federal Reserve data show that total industrial production increased 0.2% in July, following a 0.3% increase in June. Manufacturing production also rose 0.2%, while manufacturing output excluding motor vehicles and parts increased 0.4%. Total industrial production was 1.1% above its year-earlier level.
Capacity utilization, however, was only 76.3%, which was 3.1 percentage points below its long-run 1972–2025 average.
That tells a nuanced story.
Factories are producing more than they did a year earlier, but there is still unused capacity across the industrial sector. Businesses may therefore have room to increase production without immediately making major new investments.
For workers in manufacturing-heavy regions, industrial production can be especially important. Stronger factory output can support transportation, logistics, warehousing, suppliers and local service businesses.
What it means: Industrial activity is not behaving like an economy in free fall. Production is growing, although capacity utilization suggests the industrial sector still has room to strengthen.
So, Is the U.S. Economy Actually Slowing Down?
Yes—but “slowing” is more accurate than “collapsing.”
The strongest evidence of moderation comes from GDP growth falling from 2.1% in the first quarter to 1.5% in the second. Payroll employment also weakened in July, while inflation remained elevated at 3.4%.
At the same time, several indicators argue against declaring a recession:
- Consumer spending continued to increase.
- Disposable personal income rose in July.
- Retail sales remained above year-earlier levels.
- Industrial production increased.
- Unemployment remained at 4.1%.
- Job openings remained substantial in the latest available JOLTS data.
The overall picture is therefore one of slower but still positive economic growth.
What Does a Slowing Economy Mean for American Households?
For most people, the economic slowdown matters through a handful of practical channels: employment, wages, prices, borrowing costs, housing and investments.
If hiring slows, job seekers may have to spend more time searching. If inflation remains elevated, households may need to devote more income to necessities. If economic growth moderates while inflation remains sticky, policymakers have less room to respond aggressively with lower interest rates.
For homeowners, borrowers and prospective buyers, interest rates can matter more than GDP headlines. A slower economy does not automatically mean mortgage rates or other borrowing costs fall immediately.
For workers, the most relevant number may be the strength of their industry rather than the national unemployment rate. Health care, technology, manufacturing, government, construction and retail can experience very different conditions at the same time.
And for investors, the economy should not be confused with the stock market. Corporate earnings, valuations, interest rates, productivity and expectations can move financial markets even when the broader economy is growing.
What Should Americans Watch Next?
The next several months will be especially useful because economic trends become clearer when multiple indicators move in the same direction.
Watch for these combinations:
- GDP slows + unemployment rises: A more meaningful warning sign.
- Job openings fall + layoffs rise: Evidence that labor demand is weakening.
- Inflation stays high + growth slows: A difficult environment for policymakers.
- Consumer spending weakens + retail sales fall: A sign households may be pulling back.
- Income growth remains solid + spending continues: Evidence of continued consumer resilience.
- Industrial production weakens for several months: A possible sign of broader business caution.
The timing of releases also matters. Economic data are revised, and initial estimates are not always the final word. The BEA has announced an annual update to GDP and related statistics beginning September 30, 2026, incorporating more complete source data and methodological improvements.
That is another reason not to overreact to one number.
Frequently Asked Questions
1. Is the U.S. economy in a recession right now?
The latest GDP data do not show a recession: real GDP increased at a 1.5% annualized rate in the second quarter of 2026. Other indicators, including consumer spending and industrial production, also remained positive.
2. Is the U.S. economy slowing down in 2026?
Yes, growth has moderated. Real GDP increased 2.1% in the first quarter and 1.5% in the second quarter. However, slower growth is not the same thing as economic contraction.
3. Why does the economy feel weaker when unemployment is still low?
National unemployment is only one measure. Hiring can slow, job searches can take longer and certain industries can weaken even while the overall unemployment rate remains relatively low.
4. Is inflation still a problem in the U.S.?
Inflation is much lower than its pandemic-era peak, but prices were still 3.4% higher in July 2026 than a year earlier. Shelter remained an important contributor to monthly inflation.
5. Are Americans still spending money?
Yes. Personal consumption expenditures increased 0.2% in July, while disposable personal income increased 0.5%. Spending growth was stronger in services than goods.
6. What happens to jobs when economic growth slows?
Companies may become more cautious about hiring before they begin laying off workers. Job openings, hiring rates, quits and layoffs can therefore provide early clues about changes in labor-market conditions.
7. Does slower GDP growth mean mortgage rates will fall?
Not necessarily. Mortgage rates depend on several factors, including inflation expectations, Treasury yields, Federal Reserve policy and financial-market conditions. A slower economy alone does not guarantee lower mortgage rates.
8. What is the most important economic number to watch?
There is no single best number. GDP measures overall output, unemployment measures labor-market conditions, inflation measures price changes, and consumer spending shows household demand. Looking at them together is much more informative.
9. How often are U.S. economic statistics revised?
Many economic statistics are revised as additional information becomes available. GDP, in particular, is released in successive estimates. The BEA also conducts broader annual updates that can change historical figures.
10. What would confirm that the U.S. economy is genuinely weakening?
A sustained combination of slower or negative GDP growth, rising unemployment, falling job openings, weaker consumer spending and declining industrial activity would provide stronger evidence of a broad economic downturn.
Reading the Economic Dashboard Without the Noise
The most useful way to understand the U.S. economy right now is to resist the temptation to find one dramatic number that explains everything.
The current data describe an economy that is losing some momentum but still expanding. GDP growth has slowed, employment conditions have softened, and inflation remains above the Federal Reserve’s preferred pace. Yet consumers continue to spend, industrial production is increasing and unemployment remains relatively low.
For Americans making financial decisions, that distinction matters. A slowing economy calls for awareness, not automatically for panic. Households can focus on the factors they can control—maintaining an appropriate emergency cushion, evaluating debt costs, monitoring employment prospects and avoiding major financial decisions based solely on a single economic headline.
The bigger story will become clearer if these seven indicators begin moving together. For now, the evidence points toward a U.S. economy transitioning into a more moderate phase rather than one that has clearly entered recession.
Seven Numbers Worth Keeping on Your Economic Radar
- Real GDP: +1.5% annualized in Q2 2026.
- Unemployment: 4.1% in July 2026.
- Job openings: 7.4 million in June, the latest fully verified JOLTS figure used here.
- CPI inflation: +3.4% year over year in July.
- Personal consumption expenditures: +0.2% in July.
- Retail sales: -0.6% month over month in July, but +5.0% year over year.
- Industrial production: +0.2% in July and +1.1% from a year earlier.