Skip to content
equitymarkets_logo Equity Markets

Deep Dive Into Equity Market Trends

  • Home
  • Economic Data
  • Weekly Market
  • Inflation & Interest
  • Stock Buybacks

Inflation & Interest

  • Home
  • Inflation & Interest
Gas pump beside a brick wall, illustrating gasoline's effect on headline inflation
Posted inInflation & Interest

Headline vs. Core Inflation: Why 3.7% and 2.6% Are Both Right

September CPI showed 3.7% headline but 2.6% core inflation. Learn what each measures, why gasoline swings the gap, and how to read both numbers.
Posted by Matt Hardy October 29, 2026
Elderly couple managing finances and bills together at home
Posted inInflation & Interest

Social Security’s 3.6% COLA vs. 3.7% Inflation: Will Your 2027 Raise Cover Rising Costs?

Social Security's 2027 COLA is 3.6% while September CPI-W ran 3.9%. See how the raise is calculated, why it can lag prices, and how to plan your budget.
Posted by Matt Hardy October 22, 2026
Pink piggy bank on a wooden table representing savings and inflation protection
Posted inInflation & Interest

Inflation at 3.7%: How I Bonds and TIPS Can Protect Your Savings

With CPI up 3.7% from a year ago, idle cash is losing buying power. Learn how I bonds and TIPS work, how they differ, and which fits your savings.
Posted by Matt Hardy October 19, 2026
Hand reaching toward floating percentage symbols representing interest rates
Posted inInflation & Interest

Real Interest Rates Explained: Why the Gap Between Yields and Inflation Matters

Nominal yields tell only half the story. Here is how real interest rates work, why they drive valuations and borrowing costs, and how investors can use them.
Posted by Matt Hardy October 17, 2026
Person fueling a car at a gas station
Posted inInflation & Interest

September CPI Jumps to 3.7% as Gasoline Surges 9.1%, Fed Hike Odds Rise

September CPI rose 3.7% year over year as gasoline jumped 9.1% in a month. Here is what drove the hotter report, what core inflation shows, and how it shapes the Fed's October 27-28 meeting.
Posted by Matt Hardy October 17, 2026
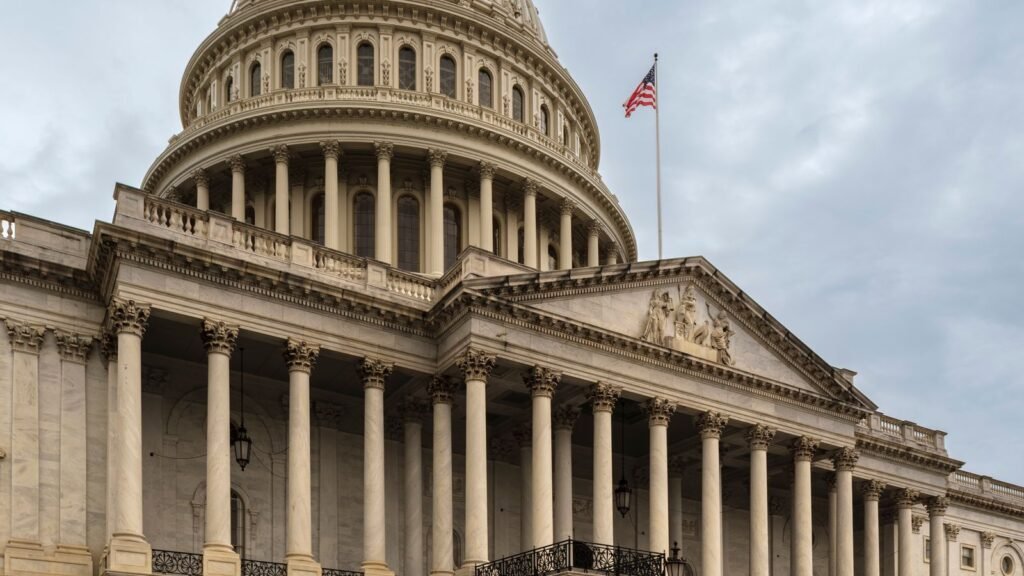
The United States Capitol Building in Washington DC, representing the Federal Reserve's first rate hike since 2023
Posted inInflation & Interest

The Fed Just Raised Rates for the First Time Since 2023 — Defying the President Who Picked the Chair

The Fed raised rates 12-0 for the first time since 2023, with Chair Kevin Warsh defying the president who nominated him. Here's the full story behind the decision, the political tension surrounding it, and what the updated projections signal for the rest of the year.
Posted by Matt Hardy October 14, 2026
Close-up of a digital screen showing financial trading graphs, representing the August CPI inflation report
Posted inInflation & Interest

August CPI Rises to 3.4% as Gas Prices Surge, Cementing Fed Rate Hike Bets

August CPI rose to 3.4% annually as gas prices surged, pushing Fed rate hike odds toward 70% ahead of next week's meeting. Here's the full breakdown of what drove the increase and why the core rate tells a more mixed story.
Posted by Matt Hardy October 12, 2026
A contemporary home with a For Sale sign in the front yard, representing rising mortgage rates and housing affordability
Posted inInflation & Interest

Mortgage Rates Hit a One-Year High: What’s Pushing 30-Year Rates Toward 7%

Mortgage rates hit a one-year high in September 2026, with the 30-year fixed at 6.71%-6.89% depending on the tracker. Here's what's driving the increase and whether rates could reach 7%.
Posted by Matt Hardy October 9, 2026
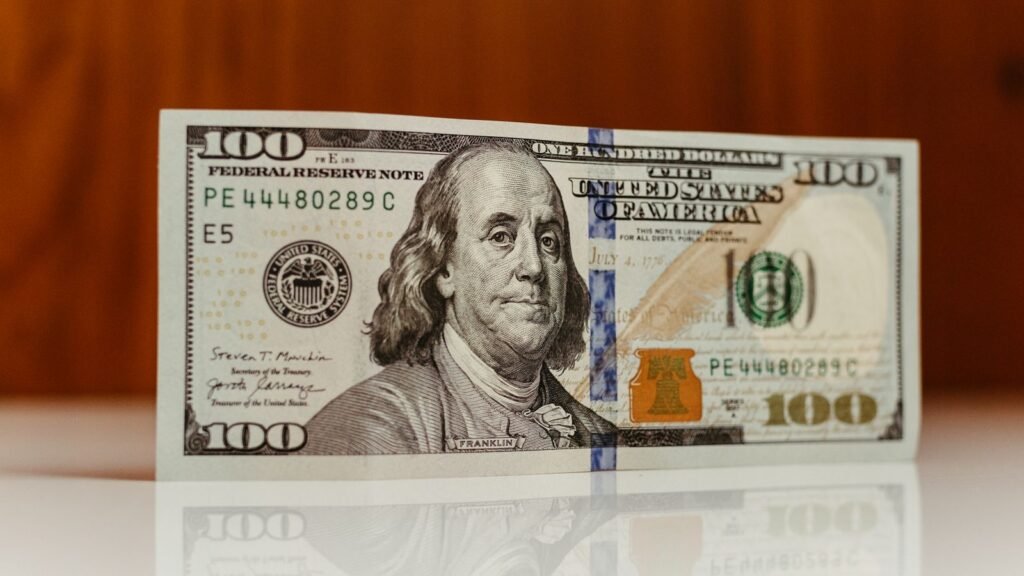
Close-up of a US one hundred dollar bill featuring Benjamin Franklin, representing core PCE inflation and the Fed's preferred gauge
Posted inInflation & Interest

Core PCE Stuck at 3.3%: What the Fed’s Preferred Inflation Gauge Really Shows

Core PCE held at 3.3% in July, stuck above the Fed's target for a second straight month. Here's what the Fed's preferred inflation gauge shows, why it's plateaued, and what it means before September's meeting.
Posted by Matt Hardy October 8, 2026
How to Build a Risk Control Framework for Your Startup in 2025
Posted inInflation & Interest

The “Higher for Longer” Era: What Sustained High Interest Rates Mean for US Businesses and Investors

For over a decade following the 2008 financial crisis, the economic landscape was defined by a singular, pervasive reality: cheap money. Interest rates were anchored near zero, and central bank…
Posted by Alex October 1, 2026

Posts pagination

1 2 3 … 5 Next page
People’s Favourite
Shareholder Yield Explained: Dividends Plus Buybacks, and How to Judge…
October 29, 2026
Headline vs. Core Inflation: Why 3.7% and 2.6% Are Both…
October 29, 2026
Fed Day Meets Big Tech Earnings: A Calm Playbook for…
October 27, 2026
GDP and PCE on the Same Day: How to Read…
October 27, 2026
Who Pays for the Buyback? Cash vs. Debt-Funded Repurchases
October 23, 2026
Categories
  • Home
  • Economic Data
  • Weekly Market
  • Inflation & Interest
  • Stock Buybacks
Important
  • About us
  • Contact
  • Disclaimer
  • Privacy Policy
  • Cookies Policy
Copyright 2026 — Equity Markets. All rights reserved.
Scroll to Top