
Skip to content
equitymarkets_logo Equity Markets

Deep Dive Into Equity Market Trends

  • Home
  • Economic Data
  • Weekly Market
  • Inflation & Interest
  • Stock Buybacks

Economic Data

  • Home
  • Economic Data
Financial newspaper showing a stock market chart, representing GDP and inflation reports
Posted inEconomic Data

GDP and PCE on the Same Day: How to Read Thursday’s Two Big Reports Without Overreacting

GDP and PCE land the same morning. Learn what each report measures, which components matter, and a simple checklist to read them without overreacting.
Posted by Matt Hardy October 27, 2026
Stock market candlestick chart on a dark screen illustrating economic indicators
Posted inEconomic Data

Leading, Lagging and Coincident Indicators: How to Tell Where the Economy Is Headed

Economic indicators do not all move on the same clock. Learn how leading, coincident and lagging data differ, and how to combine them into a clearer read.
Posted by Matt Hardy October 19, 2026
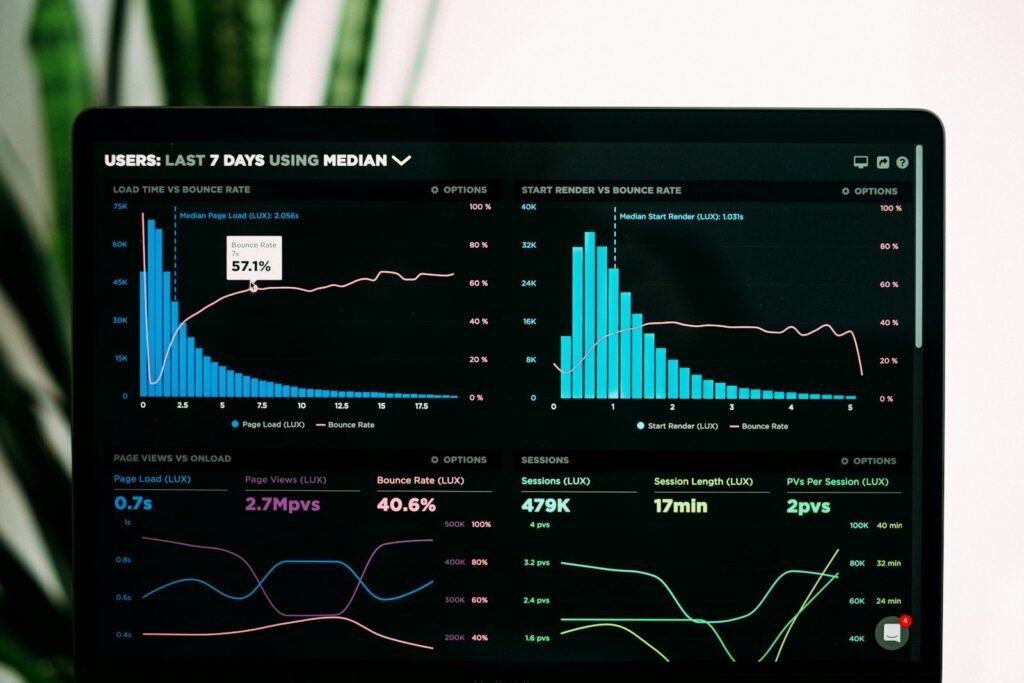
Graphs of performance analytics on a laptop screen
Posted inEconomic Data

Data Revisions Explained: How to Read Economic Reports Without Overreacting

Economic releases are estimates that get revised. Learn why revisions happen, which reports change most, and how to read data without overreacting to one print.
Posted by Matt Hardy October 17, 2026
A bustling shipping port with stacked cargo containers and cranes, representing durable goods trade and manufacturing activity
Posted inEconomic Data

This Week’s Key Data: Durable Goods Orders as a Window Into Business Investment

This week's calendar brings Durable Goods Orders, Housing Starts, and Jobless Claims — with durable goods offering a genuine forward-looking read on business investment that lagging indicators can't provide. Here's what to watch and why core versus headline matters.
Posted by Matt Hardy October 15, 2026
Contemporary skyscrapers in the New York financial district, representing labor market and housing data releases
Posted inEconomic Data

Jobless Claims Hold Near Multi-Decade Lows as Housing Starts Rebound

Jobless claims held near a 60-year low while housing starts were set to rebound from a weak July, offering a genuinely mixed but resilient economic data picture heading into the Fed's decision. Here's the full breakdown.
Posted by Matt Hardy October 13, 2026
Contemporary skyscrapers in the New York financial district, representing markets awaiting this week's PPI and CPI inflation data
Posted inEconomic Data

PPI Today, CPI Tomorrow: The Last Inflation Data Before the Fed’s Big Decision

PPI lands today and CPI tomorrow — the last inflation data before the Fed's September 16 decision, with markets pricing a genuine coin-flip on a rate hike. Here's what's at stake and how markets are positioning ahead of the numbers.
Posted by Matt Hardy October 11, 2026
A young man using a smartphone and credit card while shopping outdoors, representing US retail sales and consumer spending
Posted inEconomic Data

US Retail Sales Fell 0.6% in July: A Cooling Consumer or a Prime Day Timing Quirk?

US retail sales fell 0.6% in July 2026, but a Prime Day calendar shift explains much of the drop — sales were still up 5% year-over-year. Here's what the data really shows about the American consumer.
Posted by Matt Hardy October 8, 2026
Mortgage Rates Just Hit 6.71%—What Does That Mean for Home Buyers in 2026?
Posted inEconomic Data

Mortgage Rates Just Hit 6.71%—What Does That Mean for Home Buyers in 2026?

Summary:The average U.S. 30-year fixed mortgage rate reached 6.71% on September 3, 2026, up from 6.66% a week earlier. For buyers, the increase means higher monthly principal-and-interest payments and less…
Posted by Matt Hardy October 7, 2026
Contemporary skyscrapers in the New York financial district, representing US GDP and economic growth data
Posted inEconomic Data

Q2 2026 GDP Slows to 1.5%: Why AI Investment Is Propping Up a Narrower Economy

US GDP grew just 1.5% in Q2 2026, down from 2.1%, as AI investment and consumer spending offset a drag from trade and government cuts. Here's what the data really shows about the health of the expansion.
Posted by Matt Hardy October 7, 2026
Jobs, GDP or Inflation: Which U.S. Economic Data Matters Most for Stocks?
Posted inEconomic Data

Jobs, GDP or Inflation: Which U.S. Economic Data Matters Most for Stocks?

Summary:For U.S. stock investors, inflation often matters most in the short term because it can change Federal Reserve interest-rate expectations, which directly affect valuations. Jobs data is nearly as important…
Posted by Matt Hardy October 6, 2026

Posts pagination

1 2 3 … 7 Next page
People’s Favourite
Shareholder Yield Explained: Dividends Plus Buybacks, and How to Judge…
October 29, 2026
Headline vs. Core Inflation: Why 3.7% and 2.6% Are Both…
October 29, 2026
Fed Day Meets Big Tech Earnings: A Calm Playbook for…
October 27, 2026
GDP and PCE on the Same Day: How to Read…
October 27, 2026
Who Pays for the Buyback? Cash vs. Debt-Funded Repurchases
October 23, 2026
Categories
  • Home
  • Economic Data
  • Weekly Market
  • Inflation & Interest
  • Stock Buybacks
Important
  • About us
  • Contact
  • Disclaimer
  • Privacy Policy
  • Cookies Policy
Copyright 2026 — Equity Markets. All rights reserved.
Scroll to Top